Publisher's note: This informative article, by Brian Balfour, was published originally in the Budget and Taxes section of Civitas's online edition.
Is your family budget being pinched by the rising cost of living? Gas, food and utilities taking a bigger bite out of your wallet?
If you're like me, you are reminded every trip to the grocery store, every stop at the gas station and every month when the bills are due that your paycheck just doesn't go as far as it used to.
But how many of you think about the rising cost of state government? The fact of the matter is, the price tag for state government has risen dramatically more rapidly than any of these other items.
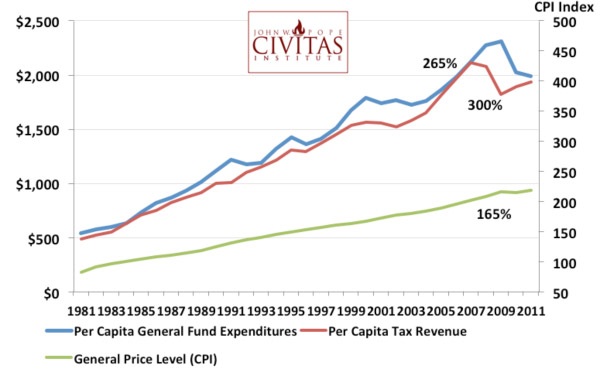
For instance, the overall price level - as measured by the Consumer Price Index (CPI) - has risen by 165 percent in the last 30 years (1981-2011)[i]. The CPI is designed to reflect the change in the cost of living to the typical American consumer. By comparison, the cost of state government to the average North Carolina taxpayer has grown exponentially faster.
Average state tax revenue collections per person ballooned by a stunning 300 percent in the last 30 years[ii] - nearly twice the rate of CPI growth. That means the average state tax bill of a Tar Heel taxpayer is now a full four times higher than it was just three decades ago.
Similarly, per capita state spending grew by 265 percent in that time span, growing at a pace 100 percentage points higher than the cost of living as measured by CPI.
Growth in Per Capita State Budget and Tax
Revenue vs. Inflation: 1981-2011
Now compare the growing cost of government to specific items straining your budget like energy, food and utilities. Surely the skyrocketing costs of those specific items have outpaced the growing cost of state government, right?
Wrong.
Data from the U.S. Bureau of Economic Analysis' Personal Consumption Expenditure price indexes track the average price level of major categories of items on which we all spend money[iii]. For instance, from 1980 to 2010 (latest data available), the price index of food purchases rose by 114 percent, far less than half the rise of our growing state tax bill. At the same time, the price index of "gasoline and other energy goods" climbed by 188 percent, and prices for household utilities increased by 209 percent. Even with government severely restricting supply and competition in those industries, both categories saw their prices rise far slower than the price of North Carolina state government.
"But that's still not a fair comparison" you may declare. "At least two-thirds of State government expenditures are for pay and benefits of state workers, and most of the services the state provides are labor-intensive. A better comparison would take into consideration rising compensation."
Fair enough. One measure that may help inform us on this point is the Employment Cost Index (ECI), compiled annually by the federal Bureau of Labor Statistics. ECI measures the average total compensation (wages, benefits, bonuses) of workers.
The ECI growth of state and local government workers, however, still falls well short of our growing state tax bill (data on state employees alone is not readily available).
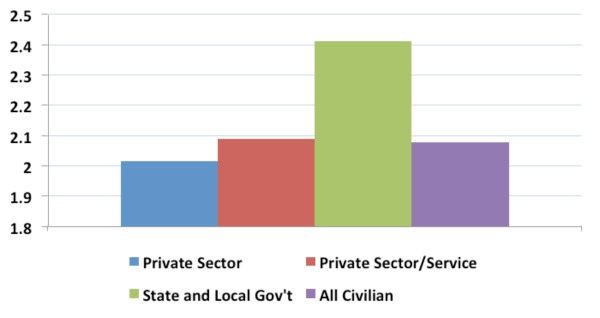
The ECI growth for local and state government workers over the last 30 years totals 241 percent[iv] - well short of the 300 percent spike in per capita tax revenue during that time. Moreover, it is also interesting to note that the ECI for state and local government workers far outpace that of private sector workers. ECI growth for the overall private sector over the last 30 years amounted to 202 percent, well short of the growth of compensation given their public counterparts. More specifically, ECI for private sector workers in the service providing industries (which includes education, healthcare and social assistance) rose by 209 percent - also far short of the largely service-providing public sector workers.
Change in Employment Cost Index: 1981-2011
In short, total compensation for government workers has been growing much more rapidly than for those in the real economy. We know that private sector wages grow as a result of increased productivity. But what explains the even more rapid growth of government compensation? Are they that much more productive than in decades past?
Not exactly. In 1990 (earliest year data is readily available), there was one state or local government worker in North Carolina for every 15.5 citizens[v]. In 2011, that ratio was little changed at 15.3. In other words, government workers have not improved efficiency in servicing the public. If anything, each worker is serving fewer citizens, so why the dramatic pay raises?
The growing cost of employment, as measured by ECI, does not explain away the rising cost of state government. In fact, we discover that state and local government workers have been receiving unjustifiably generous compensation increases over the last twenty years, especially in comparison to similar occupations in the private sector.
The data clearly shows that the cost of state government here in North Carolina has been rising dramatically for decades , at a rate far more out of control than virtually any other item that affects our pocketbooks.
Taxpayers and voters should keep this perspective in mind as they continue to hear the misleading cries of "draconian cuts" to the state budget ringing in their ears.
[i] CPI numbers taken from July that begins each fiscal year, based on Bureau of Labor Statistics data, and obtained from www.inflationdata.com; full chart can be found at: ftp://ftp.bls.
gov/pub/special.requests/cpi/cpiai.txt
[ii] Tax revenue and state budget data taken from "2011 ANNOTATED COMMITTEE REPORT ON THE CONTINUATION EXPANSION AND CAPITAL BUDGETS" Fiscal Research Division. Population estimates are for July that begins each fiscal year, and taken from the Office of Sate budget and Management.
[iii] Bureau of Economic Analysis, Table 2.4.4. Price Indexes for Personal Consumption Expenditures by Type of Product. Available at: http://www.bea.gov/iTable/iTable.cfm?ReqID=9&step=1
[iv] Bureau of Labor Statistics, "Employment Cost Index, Historical Listing," available at: http://www.bls.gov/web/eci/ecicois.pdf
[v] Bureau of Labor Statistics, State & Metropolitan Employment, Hours and Earnings; Population source: U.S. Census Bureau www.census.gov