Publisher's Note: This post appears here courtesy of the
John Locke Foundation. The author of this post is
Dr. Andy Jackson.
- The North Carolina Supreme Court provided little guidance to the General Assembly on how to draw maps that comply with their February 4 order
- The most efficient way to draw remedial maps may be for legislators to use plaintiffs' expert witness' testimony to guide them
- Following expert testimony would lead to a 9-5 Republican congressional map with three competitive seats
A February 4 North Carolina Supreme Court order struck down the congressional and state legislative maps enacted by the General Assembly. The legislature now has until February 18 to submit the maps to a Wake County Superior Court panel.
What Map Drawers Must Work With
The North Carolina Supreme Court's instructions to legislators in the February 4 redistricting order are
"thin and, on its face, contradictory." A February 8 order from the trial court put some meat on the bones of the Supreme Court order, but there is still little guidance for the General Assembly to use.
I will focus in this report on the last three items the trial court wants the General Assembly (and plaintiffs, if they choose to submit maps) to include in a written submission that
"shall provide an explanation of the data and other considerations the mapmaker relied upon to create the submitted Proposed Remedial Plan and to determine that the Proposed Remedial Plans are constitutional" (pages 3 and 4):
- Whether there is a meaningful partisan skew that necessarily results from North Carolina's unique political geography. SCONC Order ¶ 6.
- What methods were employed in evaluating the partisan fairness of the plan-e.g., "mean-median difference analysis, efficiency gap analysis, close-votes, close seats analysis, and partisan symmetry analysis"-as partisan fairness is defined in Paragraph 5 of the Order. SCONC Order ¶ 6.
- Whether the statistical metrics indicate a "significant likelihood that the districting plan will give the voters of all political parties substantially equal opportunity to translate votes into seats across the plan." SCONC Order ¶ r6.
Reverse-Engineer Expert Witness Findings
As I mentioned in my previous report, the measures the North Carolina Supreme Court noted (such as mean-median difference analysis) do not by themselves account for geography, so items
"d" and
"e" above will have to be reconciled. Political scientists Michael D. McDonald and Robin E. Best proposed what has become the norm in redistricting analysis (page 320):
evaluating a plan against a set of alternative plans that have been produced using neutral criteria... through algorithms used to generate compact, contiguous, and equipopulous districts drawn without conscious partisan considerations.
Several expert witnesses for the plaintiffs used such sets of alternative plans drawn through algorithms. Considering the short time frame legislators have only to draw maps rather than draw maps and then analyze them later, it may be better to draw maps that fit within the analyses already performed by the expert witnesses. Since the witnesses had used the methods the court requested in their analyses, maps that fit their conclusions would be compliant with the court order.
For this report, I use the written testimony of Dr. Daniel B. Magleby and Dr. Jowei Chen. They used different methods, but their conclusions are similar. I do not include the testimony of any defense witnesses since the plaintiffs prevailed in court.
Baseline congressional seat distribution: Magleby analyzed a subset of 1,000 maps that he said best fit neutral redistricting criteria. Here are his findings on the most common party distribution of seats (page 22):
The most common outcome, occurring in 374/1000 simulations, in the simulation was Democrats carrying 5/14 districts based on the composite partisan score. Democrats carried 6/14 districts in nearly as many districts (349/1000 simulations).
Chen's analysis was more definitive. He found that the most common outcome by far was a 9-5 Republican majority. That was the outcome in 59.6% of his maps.
Swing Districts: Chen's analysis (Figure 4 on page 25) found that Republicans would have seven safe seats in a typical (50.8% Republican vote share) election and Democrats would have four safe seats. One seat would lean about 53-47% Republican, one would lean about 52-48% Republican, and a third would lean about 54-46% Democratic. Similarly, Chen found that the most common number of competitive seats (which he defined as a Republican two-party vote share between 47.5% and 52.5%) in his ensemble of maps was two.
Magleby's report did not include data that indicated swing districts.
What a Compliant Congressional Map May Look Like
Using DRA 2020, a free web-based redistricting application, I drew districts to fit within Chen's and Magleby's findings (Figure 1). I did not use political data to draw the maps. Given the court's order to the General Assembly to use racial data, I decided to use racial data to ensure that at least two districts were Voting Rights Act-compliant using a traditional measure of 37% Black voting-age population. That percentage is an
"empirical bright line" for districts where black voters have a chance to elect candidates of their choice.
Figure 1: Example congressional district map drawn to comply the North Carolina Supreme Court order in North Carolina League of Conservation Voters v Hall. Graphic source: DRA 2020

The map splits 12 counties 13 times and splits 13 voting tabulation districts (precincts) statewide. While I endeavored to keep municipalities whole, especially the core of municipalities, I do not have a count of split municipalities.
No incumbents running for reelection are "double-bunked" into the same district.
The districts are reasonably compact, with a collective Reock score of 0.4511 and a Polsby-Popper score of 0.3453. The Reock score is within the average Reock score of 0.45 to 0.46 on Chen's ensemble of maps. The Polsby-Popper score is slightly less compact than the average of 0.37 to 0.39 in Chen's ensemble of maps. At least some of the loss of compactness is due to my drawing the 9th Congressional District in Charlotte to be VRA-compliant.
As seen in Figure 2, Republicans are favored to win in nine of the fourteen districts in the example map. Those numbers come from ten statewide races: U.S. president, governor, lt. governor, U.S. senator, and attorney general races in 2016 and 2020.
Figure 2: Two-party vote share of districts in example congressional district map with districts arrayed from most Democratic to most Republican.
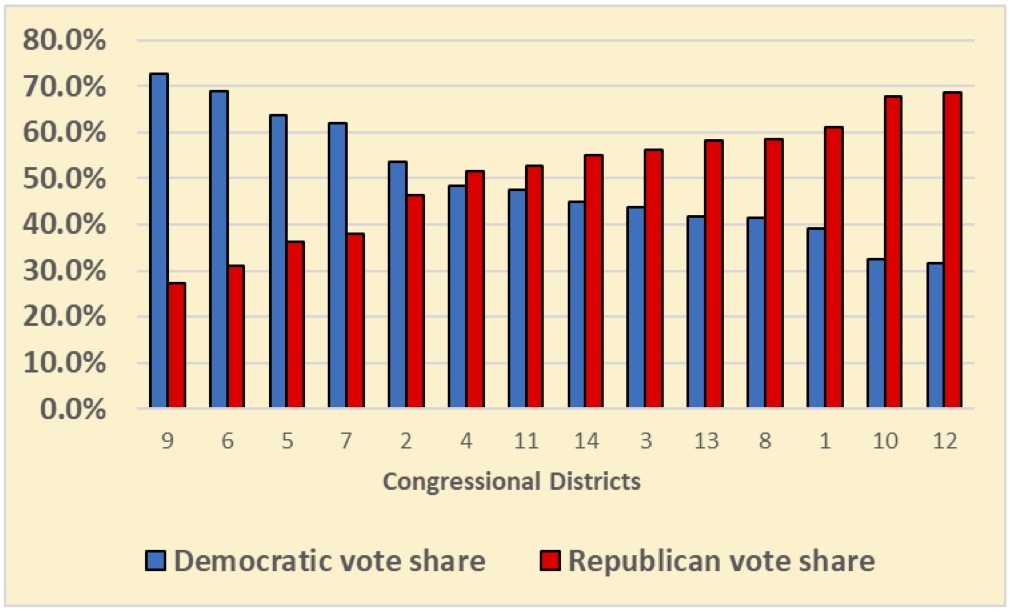
Three districts would be in the competitive range of less than a ten-percentage-point difference in two-party vote share, with one of the Republican-leaning districts being very close at 51.6-48.4%.
Many Ways to Skin the Redistricting Cat
I drew
"a" map compliant with the February 4 North Carolina Supreme Court order, not
"the" map compliant with the February 4 North Carolina Supreme Court order. It demonstrates how the General Assembly can efficiently comply with the order.
Knowing what the North Carolina Supreme Court's order requires and does not require may even help make room for compromise between Democratic and Republican legislators on congressional districts.