Publisher's Note: This post appears here courtesy of the
John Locke Foundation. The author of this post is
Dr. Andy Jackson.
A panel of the Wake County Superior Court has until February 23 to select remedial state legislative and congressional maps to replace the maps the North Carolina Supreme Court overturned on February 4. As part of the Supreme Court's order, the General Assembly was instructed to submit remedial maps. The court also told defendants that they could submit maps as well.
The court is obliged to accept state legislative and congressional maps submitted by the General Assembly.
To understand why that is so, it is important to remember that the trial court is not choosing what they believe to be the best map from among those submitted. Article II, Sections 3 and 5, of the North Carolina Constitution specifically requires that North Carolina House and Senate districts be drawn by the General Assembly. Article II, Section 22 also specifies that congressional districts originate from bills in the General Assembly.
So the court can only reject maps submitted by the General Assembly if those maps are constitutionally defective. Only then can it consider maps from the plaintiffs.
So, do are the remedial maps submitted by the General Assembly constitutional by the criteria selected by the Supreme Court? While the court's criteria are vague, the evidence indicates that the General Assembly maps are compliant.
Checking Compliance of Remedial Maps
To find the range of possible maps acceptable under the court's criteria, I examined the range of median-mean gaps in an ensemble of maps drawn using politically neutral criteria as indicated by plaintiff expert witness Dr. Daniel B. Magleby. The graphs below each table were taken from Magleby's written testimony. I then added the mean-median scores for each of the proposed redistricting plans to those graphs.
Due to time constraints, I uploaded the various remedial map proposals onto DRA 2020 (DRA, a free online mapping program from Dave's Redistricting) and used their median-mean measures based on the composite results of several elections. The Elections used in DRA were Gov. 2016, Lt. Gov 2016, President 2016, Attorney General 2016, Treasurer 2020, Senator 2016, Lt. Gov. 2020, US Senate 2020, President 2020, Attorney General 2020, Governor 2020.
In each of the graphs below, the red line indicates the mean-median score of the map enacted by the General Assembly in November. The only colored marks are based on median-mean difference scores as calculated on DRA: the red asterisk is the enacted map, the green line is the legislative remedial map, the blue line is the North Carolina League of Conservation Voters (NCLCV) map, and the purple line is the map from the Harper v Hall plaintiffs.
Congress
Figure 1: Graph of range of median-mean difference scores of Congressional maps from Magleby page 23 with remedial map data superimposed.
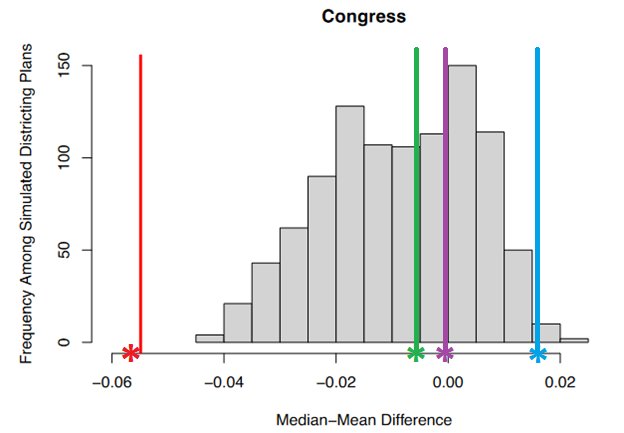
As seen in Figure 1, Magleby found
"the median-mean difference ranged from -0.042 to 0.025. the distribution is bimodal with two peaks at just greater than -0.02 and another peak at a little above 0.0" Negative numbers indicate a Republican advantage while positive numbers indicate a Democratic advantage. Above two-thirds of Magleby's randomly-drawn maps are skewed in favor of Republicans, indicating that maps drawn without partisan intent tend to favor Republicans.
The original congressional map drawn by the General Assembly (red asterisk and line) falls outside the range of median-mean difference scores and is a partisan gerrymander based on that measure. On the other hand, the map submitted by the NCLCV (blue, median-mean difference score of 0.017) is on the far right edge of the range of median-mean scores and is thus likely a Democratic gerrymander.
Both the legislative remedial (green, -0.007) and the Harper plaintiff's (blue, -0.001) maps are within the normal range of median-mean difference scores, meaning that neither would be considered a partisan gerrymander by that measure.
North Carolina House
Figure 2: Graph of range of median-mean difference scores of North Carolina House maps from Magleby page 14 with remedial map data superimposed.
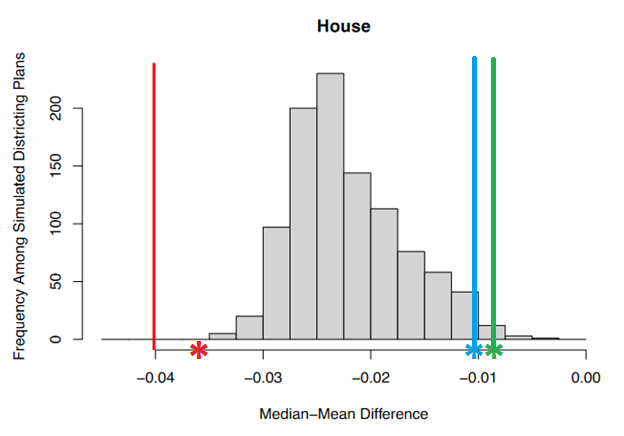
As seen in Figure 2, the median-mean difference scores of the North Carolina House map enacted by the General Assembly last November is a gerrymander as indicated by the data both from Magleby (red line) and DRA (red asterisk). The other striking thing about that figure is how far both the legislative remedial map and the proposed NCLCV map are from the middle range of median-mean difference scores.
I wrote on February 18 how House Republicans capitulated to Democrats on this map:
You could be forgiven for thinking that the minority Democrats wrote the remedial map with an outcome like that. To a large extent, they did. Democrats offered seven amendments to change the map, and Republicans joined them in approving six of them.
That capitulation shows in the mean median difference score of -0.008 for the legislature's remedial House map (Green in Figure 2). That puts the remedial House map approved by the Republican-controlled General Assembly on the edge of being a Democratic partisan gerrymander. It is so extreme that even the NCLCV map (blue, -0.011) is less friendly towards Democrats.
North Carolina Senate
Figure 3: Graph of range of median-mean difference scores of North Carolina Senate maps from Magleby page 19 with remedial map data superimposed.
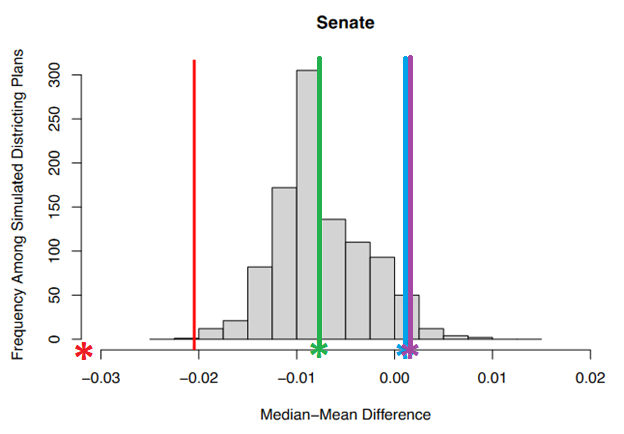
I approach the Senate analysis with some caution because the DRA median-mean difference score for the enacted map (red asterisk, -0.037) was very different than Magleby's data (́red line, -0.009) indicated.
As it is, none of the submitted maps would qualify as gerrymanders. The legislative remedial map (green line, -0.008) is much closer to the middle of the range of median-mean difference scores than are either the NCLCV (blue, 0.001) or Harper (purple, again 0.001) submitted maps.
If the DRA data is shifted to be more in line with Magleby's data, then all the maps would be friendlier to Democrats than they are in Figure 3. The legislative remedial map would be on the edge of being a Democratic gerrymander and the NCLCV and Harper maps would be extreme partisan gerrymanders.
The Bottom Line: The Legislative Remedial Maps Are Constitutional and Must Be Accepted
The purpose of all this sociological gobbledygook was to answer an important question: are the remedial maps submitted by the General Assembly compliant with constitutional standards as expressed by the North Carolina Supreme Court. As seen above, the answer for all three maps is
"yes."
Since the remedial maps submitted by the General Assembly are compliant with the court's order, the court has no constitutional reason not to accept those maps, regardless of how they might feel about the maps the plaintiffs submitted.
Again, the court is obliged to accept state legislative and congressional maps submitted by the General Assembly.