Anomalies from the 2020 election that need to be investigated | Eastern NC Now
New study by North Carolinian led team raises significant issues
Election irregularities in the 2020 presidential election continue to be uncovered through independent analysis. An expert team led by physicist and Mensa John Droz, Jr., (a resident of Morehead City, NC) has been relentlessly examining election-related data and lawsuits since November, uncovering significant anomalies that warrant further investigation. The team’s objective throughout has been to help ascertain that all legal votes – and only legal votes – were counted. These efforts were previously reported out here, here, and here.
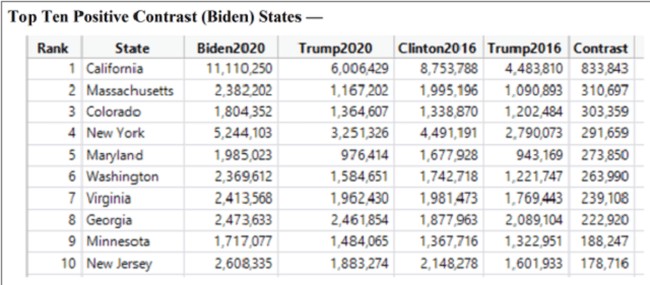
The team has just completed a “contrast analysis” of Biden versus Trump results in 2020 and Trump versus Clinton results in 2016 that exposes some irregularities that cannot be easily explained. An example from the report is provided below that explains what a contrast analysis is:
[I]n California, Biden beat Trump by 5± million votes (2020), whereas Clinton beat Trump by 4± million (2016). Doing the arithmetic, the contrast is 833,843 votes. (Statisticians call this the Difference of the Differences, or DoD.) Note that Trump increased his California vote total [from 2016 to 2020] by 1.5± million votes. However, Biden increased the Democrat candidate’s vote total by 2.3± million [from 2016]. Where did California find 3.8± million more votes in 2020 than in 2016? Easy, you say: California’s population has increased.
That’s a good thought, but between 2016 and 2020, the Census Bureau says that the population of California increase by less than 700,000 people. (Note that this includes children not old enough to vote, non-citizens, non-registered citizens, etc.). However, as mentioned above, the 2020 vote total for the Democrat candidate increased by 2.3± million votes. On the face of it, that significant vote increase does not appear to be logically explainable.
In fact, one logical explanation for the contrast would be that President Trump’s 1.5± million increase in vote totals from 2016 to 2020 came from people who voted for Hillary Clinton in 2016 or who sat out the 2016 election. Where could Biden’s 2.3± million increase over Clinton’s total in 2016 have come from? Note: as the team reports, “A statistical contrast is not proof of voting fraud, but a large contrast does point to situations that might merit closer examination.” And that is exactly the purpose of the team’s contrast analysis: to identify states in which vote tabulations could warrant further analysis, peeling the onion to the county and precinct levels as appropriate in order to forensically validate the results.
In prior Presidential elections, the highest state voter turnout in the country was: 2016 = 75%, 2012 = 76%, 2008 = 78%, and 2004 = 79%
Based on [the above] historical data, any state showing a Presidential turnout rate in excess of 80% should be considered suspect.
Of the top 10 states with the highest 2020 voter turnout rates, the top five in population all went for Biden.
The team performed contrast analyses for 48 states (Alaska and Maine were not examined due to lack of data), with a positive contrast indicating that Biden scored more votes in 2020 than expected in that state, and with a negative contrast indicating that Trump did better in 2020 than expected. The team also performed a contrast analysis for each county in each state in order to determine outliers that are good candidates for precinct-level analysis. Several outlier states were identified in which the positive contrasts for Biden could not be easily explained by population increases in those states. In addition, the ten states with the largest positive contrasts provided 3± million more votes for Biden than they did for Clinton, as shown in the table below. Is that really possible without fraud, given Biden’s unwillingness to campaign and inability to draw a crowd when he did?
Here are some other observations from the contrast analyses performed by the team:

|
Fightback.law
#fightback |
| Arizona pushes back in favor of honest elections | Editorials, Beaufort Observer, Op-Ed & Politics | DOD announces grants that will help military spouses |


Meanwhile I watched the Frontline special on PBS last night - "Trumps American Carnage" where I learned that virtually all of my friends, my family and I are violent white supremacist insurrectionist assaulting American Democracy.
I guess that means you too Herschel. How about I send you a white KKK hood in exchange for a Georgia Bulldogs jersey. Oh crap, I'll bet bulldogs are racist symbols now a days - especially those southern bulldogs. Welcome to 21st Century America according to the Left!
Needless to say, anyone with questions concerning election irregularities and election law violations is a conspiracy theorist (according to the Lefty intelligentsia). Of course none of that applies if you are Hillary Clinton or Stacy Abrams.
The propaganda coming from the Left these days makes a professional wrestling plot or a Saturday Night Live skit look like a rocket science equation.