Publisher's Note: This post appears here courtesy of the
John Locke Foundation. The author of this post is
Dr. Robert Luebke.
- While newly released data show four-year graduation rates for North Carolina public schools are comparable to pre-pandemic rates, there are deeper concerns about what knowledge and skills students have when they graduate and also about the persistence of racial achievement gaps
- Recent declines in test scores and graduation rates highlight the failure of school closures and virtual learning
- The good news is that schools have the money and the know-how to address learning loss, but will they do the right thing?
Last week the North Carolina Department of Public Instruction (DPI) released state test results and graduation rates. Two years into a pandemic in a state where schools were closed or offered only virtual learning, it's not surprising that the news about state test results wasn't good. Only 51.2 percent of students passed state exams last year. For more perspective and analysis on state test results, see this recent article by Terry Stoops.
DPI also calculates four- and five-year cohort graduation rates. This article will focus on four-year cohort results, specifically students who entered ninth grade in the 2018-19 school year and graduated four years later. DPI provides these data by county and schools. (A future research brief will review those data.)
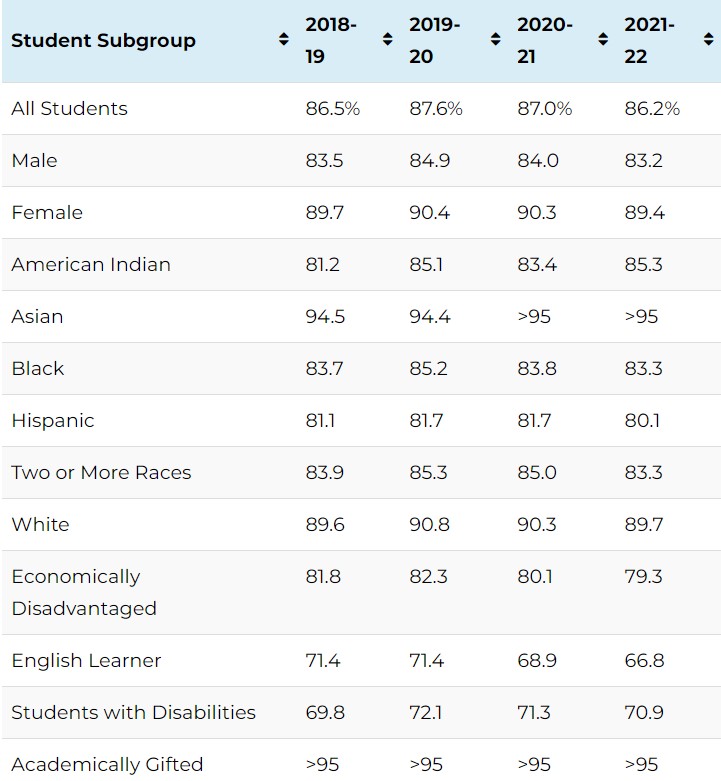
The following table provides comprehensive four-year cohort graduation rates by year and student subgroup from academic years 2018-19 through 2021-22. Given the significant impacts on students, test taking, and school accountability brought about by Covid-19 and government and school policy responses to it, DPI recommends that any comparisons made should be made to 2018-19, the last academic year prior to the pandemic.
Statewide Four-Year Cohort Graduation Rates, By Year and Student Subgroup
(Percentage of students graduating in four years after entering as freshmen)
What Can We Learn?
As you can see, 2021-22 graduation rates are comparable to 2018-19 rates. But that's not the whole story. The 2021-22 data represent the second consecutive year that graduation rates for all students in North Carolina declined. The decline represents 1.4 percent over two years or approximately 22,000 students.
While it is important to make comparisons across years, it's also important to see how these changes have impacted the last year. Only five subgroups (American Indian, Asian, Students with Disabilities, White, and Academically Gifted) had graduation rates at or above where they were in 2018-19. Graduation rates for all subgroups, however, declined in the last year and some significantly. For example, in the past two years the four-year graduation rate for Hispanics declined from 81.7 percent (2019-20) to 80.1 percent (2021-22). Graduation rates for English Learners declined from 68.9 percent to 66.8 percent, while those of Economically Disadvantaged students declined from 80.1 percent to 79.3 percent.
Yes, overall, graduation rates are near pre-pandemic levels. Nevertheless, this news should not obscure two troubling facts. First, for most student subgroups, graduation rates have declined the past two academic years. Second, graduation rates for poor and minority students continue to lag, and they may have even lost more ground during the pandemic.
A Deeper Dive
The underlying concern with any discussion of graduation rates is academic preparedness. North Carolina's overall graduation rates are near pre-pandemic levels, but academic test scores have plummeted. Students are graduating, but are they ready for college and work? A closer look at two indicators can help us answer that question.
The first indicator would be the end-of-grade (EOG) and end-of-course (EOC) scores for the North Carolina Student Achievement Tests. Of specific interest here is the percentage of students who scored at Level 4 and above in Reading in 2021-22 (indicating
"College and Career Readiness") at every grade level. On average Level 4 reading scores in Grades 3 through 8 averaged almost 16 points less than the 2018-19 pre-pandemic score.
This year's Level 4 Grades 3 through 8 scores were slightly better than last year for all grades except Grade 3, where scores dropped 6.6 percentage points. Nevertheless, there were troubling signs. In 2021-22 the percentage of students achieving Level 4 in Reading for Grade 3 was 27.1 percent; in Grade 8, 28.7 percent. That's basically a flat line with little or no improvement with each grade level compared to last year. Pre-pandemic, those scores were 45.2 percent and 43.5 percent. The pattern is the same but with higher numbers in Math. With regard to Level 4 Math, 2021-22 scores were up from the previous year at every level but still significantly below scores from 2018-19. The percentage of Grade 3 students performing at Level 4 in Math was 36.0 percent in 2021-22 vs. 44.1 percent in 2018-19; in Grade 8, 25.6 percent in 2021-22 vs. 34.3 percent in 2018-19. As in previous years, state achievement tests showed persisting racial achievement gaps.
At the high school level, the news was mixed. The percentage of students performing at Level 4 in Math 3 in 2021-22 exceeded the percentage of students in 2018-19 (32.1 percent vs. 26.2 percent). In other subject areas like Math I and Biology, students showed strong increases over the previous year but still trailed pre-pandemic levels. Nevertheless, only about one in 10 students in Grade 9-12 Math I achieved Level 4 in 2021-22, meaning almost 90 percent failed to demonstrate college and career readiness. Regarding NC Math III, 32.1 percent of test-takers in 2021-22 achieved Level 4, which was not only a significant improvement over last year (25.1 percent) but also even higher than the scores posted in 2018-19 (26.2 percent). Still, almost 68 percent of students failed to achieve Level 4.
Meanwhile, about 35 percent of high school students who took English II tests in 2021-22 achieved Level 4, which was the same percentage as the previous year but much lower than the 50.3 percent in 2018-19. High School Biology scores were a little better in 2021-22, with 43.4 percent of students demonstrating college and career readiness. That's over five points better than the previous year but still over eight points less than the 51.7 percent in 2018-19. Again, throughout the data are pronounced racial achievement gaps, which continue to persist.
The second indicator of academic preparedness would be ACT scores. This indicator is also in decline, but it's difficult to tell exactly how much. In North Carolina, eleventh graders are required to take the ACT, and DPI reports the percentage who achieve at least the required minimum score for University of North Carolina system admission. Up until 2021-22, that score was 17 (out of 36). UNC was sufficiently dissatisfied with the academic preparation of students, however, that it raised its admission requirements, upping its minimum required ACT score to 19.
In 2021-22, 41.7 percent of students met or exceeded the benchmark score, compared with 55.2 percent in 2020-21 - a marked decline. How much of that decline owes to UNC raising the benchmark score is hard to tell. Still, the scores speak to persistent problems. In 2021-22, 55.9 percent of white students and 70.4 percent of Asians met or exceeded the benchmark, but only 18.6 percent of Black students and 26.0 percent of Hispanics did. Also, only about four of every 10 students met UNC system minimum admission requirements.
Conclusion
It's easy to get lost in the data. One lesson comes through loud and clear: shutting down schools was disastrous. Virtual learning didn't work, and our kids are paying for it. Yes, there is some encouragement in overall trend lines since last year. But academic performance is still seriously lagging and is even worse among minority and disadvantaged groups. It is time to redouble efforts to remedy learning loss. Texas and Tennessee offer good models about how to help students and scale up programs. The federal government has provided $6 billion to help North Carolina schools remedy learning loss and address the disparate impacts felt by low-income and minority students. It's time schools start using this money wisely and put the harmful impacts of pandemic policies in the rearview mirror.