Publisher's Note: This article originally appeared in the Beaufort Observer.
There is a vociferous debate going on in North Carolina right now between commercial fishermen and sports fishermen. Due to a highly funded lobbying campaign the sports fishermen are winning. They are the ones who fish as a hobby. Commercial fishermen are the traditional mainstay of the industry that provides seafood for fish markets. The current issue is explained in a
recent article posted here on House Bill 353.
At the heart of HB 353 is an argument that certain species of fish are becoming endangered. That argument is based on data collected by the National Oceanic and Atmospheric Administration (NOAA). That the same bunch that each year issues hurricane projections which are notoriously inaccurate.
But the NOAA just acknowledged that the numbers that have been used are not valid or reliable but the new model appears to also be seriously flawed.
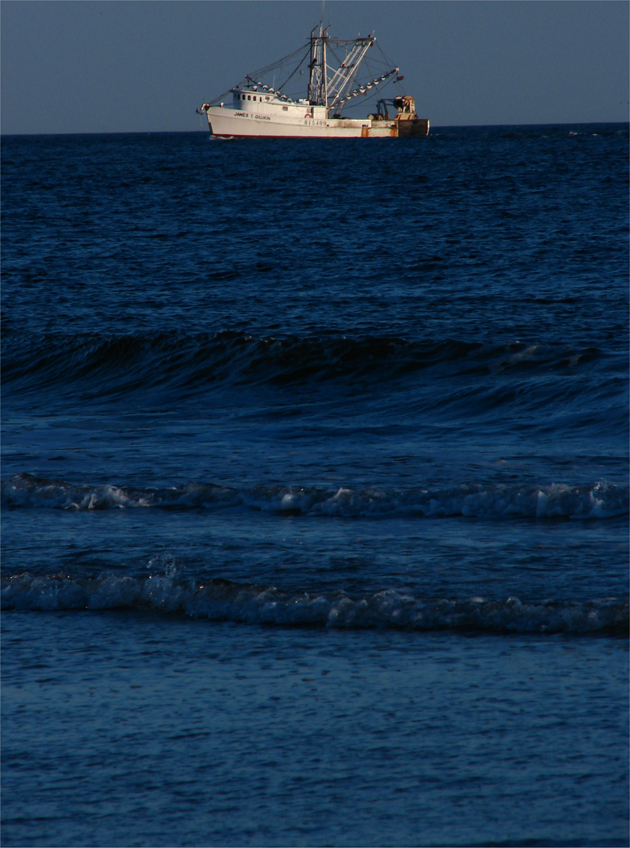 Commercial shrimp trawler off Oregon Inlet. photo by Stan Deatherage
Now we learn that they have been using a fish counting technique that has questionable validity. But not to fear, they recognize this and are revising it and they have just announced a new technique and are releasing data using the new model. It's supposed to be more accurate. You can read about it by
clicking here. Prepare to spend some time if you want to get a real handle on how they do the fish population statistics.
We've spent some time on it and have come to a preliminary conclusion: These data are bogus just as much as the old data were. At least it is bogus for what it is being used for.
We'll spare you the complicated explanation but here's the short version: There is too much variance in the data to draw valid conclusions about which fish are endangered and which ones could thrive even if more of them were caught.
There is a questional premise at the conceptual level of these data also. What they do is count the number of fish a sample of fishermen (who participate in the project) report they catch. That's interesting and somewhat useful, but far from conclusive. That forces the use of inferential statistics in projecting from a sample to a general population. Inferential statistics are good at doing that so long as the variables are fairly stable. But while the counts bounce all around on a scatter gram it is hard to "fit a line," as the nerds say, between the points. The more the line zigs and zags the less reliable the prediction of what the next data point (the number of fish that should be caught next year) will be.
Here's the way our stats professor illustrated this problem. Suppose you want to predict what the temperature will be on a given day one month hence. You can't rely on current weather conditions such as temperature, impending fronts, barometric pressure, water vapor in the atmosphere etc. You have to rely on climatic data. That is the historical record of temperatures for that day over several years.
Now, suppose you know that the average temperature on that day for the last one hundred years was 70 degrees. You would think it a pretty fair guess to say the temperature next month on that day will be 70 degrees. And on average you will be pretty close. But then suppose I told you that while the average had been 70 degrees the range was from 50 to 80 degrees. You would have less confidence in your prediction of 70 degrees would you not? Of course. But then, alternatively, if I told you that the range had only been between 65 and 75 you'ld probably be more confident in predicting 70 degress. That's like the guy at the fair who predicts your weight--within plus or minus 3 pounds. If the guy across the midway is predicting it between plus or minus 10 pounds which booth would you spend your money on?
We're taking about a measurement of how much variance there is in the data. The more variance the less likely your prediction, based on the average, will be within an acceptable range.
And that is exactly what these fish counts show. The amount of variance in the number of a particular species of fish caught each year varies tremendously. For example, for striped bass (one of the species that is being debated in HB 353) the numbers varies between 2005 and 2011 from 130,794 to 319,880. So ask yourself, how many will be caught in 2012? And how much money would you be willing to bet on your guess? It gets even harrier to predict when you know that the two highest years were 2011 and 2005 and the two lowest years were 2007 and 2009. In other words, there is no straight line that you can base a trend on so that you can take multiple years into consideration in your prediction. You would do just as well if you wrote a number on separate sheets of paper, from the low to the high with equal increments in between on a number of sheets of paper and then dumped them down the steps and picked the sheet that landed on the middle step as your prediction.
The question is: Would you be willing to bet millions of dollars on how accurate your prediction would be? Would you be willing to put hundreds or thousands of families out of business, or conversely would you be comfortable that you would not catch so many fish that you endangered the future populations of that species?
The decision the General Assembly will make on HB 353 and its progeny will do just that. Those policy decisions will significantly impact real people's lives. But those policy decisions will be based on imprecise data. It is imprecise simply because there is too much variance in the numbers to make them reliable or valid.
Commentary
We would suggest that the General Assembly focus its attention on what level of reliability and validity they would feel comfortable with making decisions in the future and then tell the experts to come back once they had data that fitted within that range. We would suggest, just for the exercise, that standard be a 95% level of confidence, verified by data over at least fifty data points. Or to put it another way, they need to decide how much variance they are willing to accept. While that's not real sophisticated statistics, most people would understand it and thus make the policy decision more acceptable.
To boil it all down, the numbers NOAA is using are just not sufficient to justify deciding how many fish should be caught next year. To pretend they are is a real injustice to people whose lives would be significantly impacted by those policy decisions and to endangered fish.
Or they could say it a different way to NOAA: Until you can predict within 3 the number of category 4 and 5 hurricanes that will hit the cost of North Carolina next season, keep working on it before you bring use any numbers back. And as Irene taught us, they also need to be able to tell us how long the eye will be over the state from three hours before it hits until three hours after it leaves the state.
You get the point. These predictions, for hurricane or fish, NOAA is putting out don't mean much.